class: center, middle, inverse, title-slide # 🎶 Don’t cha wish your ggplot had colours like me? 🎶 ## ISSC Mini-Tutorial ### Liza Bolton ### The University of Toronto ### 2021-05-18 --- [🎶 The Pussycat Dolls - Don't Cha ft. Busta Rhymes](https://www.youtube.com/watch?v=YNSxNsr4wmA) Image credit: [Giphy](https://giphy.com/gifs/nicole-scherzinger-pussycat-dolls-pcd-zHWESnDS3rJXG) <img src="https://media.giphy.com/media/zHWESnDS3rJXG/giphy.gif" width="700" style="display: block; margin: auto;" /> --- # Colour matters! <img src="images/colour-pencils-color-paint-draw-50996.jpeg" width="700" style="display: block; margin: auto;" /> --- class: inverse, center, middle # Why? --- # Colours can: -- - .large[influence emotion, which can influence how people understand your data.] -- - .large[connect to meaning. (Hot and cold? .red[**Red**] and .blue[**blue**].)] -- - .large[show **more** or .gray[**less**] with intensity/brightness.] -- <br></br> Good discussion in this [interview with Maureen Stone,](https://www.fastcompany.com/3062182/how-to-use-color-to-prove-your-point-from-a-data-viz-expert) a colour expert with Tableau. --- # What's this talk for? -- - .large[tips about what to think about when *picking* palettes] -- - .large[showing some cool/useful palettes] -- # Assumptions I'm making -- - .large[you are somewhat familiar with `ggplot` and R in general] -- - .large[you don't need heaps of technical info on hex codes and colour theory for this to be fun and useful] --- # How do you tell computers about colours? -- .large[You'll usually see a colour written in one of 4 ways: - Just as a **colour name**, like "red". Has to be one R recognises - [list here](http://www.stat.columbia.edu/~tzheng/files/Rcolor.pdf) - As a mix of **hue, saturation and lightness** (HSL) - As a mix of **redness, greenness and blueness** (RGB) - As 6 numbers/letters with a # at the front eg. #ff0000 (**Hex code**)] [Useful colour tool](https://www.w3schools.com/colors/colors_picker.asp) [Chrome extension for picking colours from webpages](https://chrome.google.com/webstore/detail/colorzilla/bhlhnicpbhignbdhedgjhgdocnmhomnp/related?hl=en) --- class: inverse, middle, center # What do you need your colours to do? --- class: middle, center .large[Just look different from each other?] -- .large[You want a **qualitative palette**.] --- .left-code[ ## Qualitative palette use case ```r # Use the iris dataset data("iris") # Create a simple barchart # of mean petal width bars <- iris %>% group_by(Species) %>% summarise(meanPW = mean(Petal.Width)) %>% ggplot(aes(x = Species, y = meanPW, fill = Species)) + geom_bar(stat = "identity") + theme_minimal() + guides(fill = FALSE) bars ``` ] .right-plot[  ] --- class: middle, center .large[Show a range from more to less?] -- .large[You want a **sequential palette**.] --- .left-code[ ## Sequential palette use case ```r # Use the iris dataset data("iris") # Make a scatterplot # points coloured by petal length petals <- iris %>% ggplot(aes(x = Sepal.Length, y = Sepal.Width, color = Petal.Length)) + geom_point() + theme_minimal() + theme(legend.position="bottom") petals ``` ] .right-plot[  ] --- class: middle, center .large[Contrast around a specific point?] -- .large[You want a **diverging palette**.] <br> <br> <br> .small[Thanks to [this Everyday analytics article](https://everydayanalytics.ca/2017/03/when-to-use-sequential-and-diverging-palettes.html) for helping my clarify my thinking on this one.] --- ## Diverging palette use case <img src="images/mf_occup.png" width="650" height="450" style="display: block; margin: auto;" /> [Source: Nathan Yau, Flowing Data]("https://flowingdata.com/2017/09/11/most-female-and-male-occupations-since-1950/") --- class: inverse, center, middle # Palette time! --- .left-code[ # Viridis <a href="https://cran.r-project.org/web/packages/viridis/vignettes/intro-to-viridis.html" target="_blank"><button class="button">📦 `Viridis`</button></a> Perceptually uniform! Gorgeous for continuous data. ```r library(viridis) library(hexbin) ggplot(data.frame(x = rnorm(10000), y = rnorm(10000)), aes(x = x, y = y)) + geom_hex() + coord_fixed() + scale_fill_viridis() + theme_bw() ``` ] .right-plot[  ] --- # Viridis <a href="https://cran.r-project.org/web/packages/viridis/vignettes/intro-to-viridis.html" target="_blank"><button class="button">📦 `Viridis`</button></a> <img src="images/viridis.png" width="98%" height="450" /> --- .left-code[ # Viridis <a href="https://cran.r-project.org/web/packages/viridis/vignettes/intro-to-viridis.html" target="_blank"><button class="button">📦 `Viridis`</button></a> ```r petals + scale_color_viridis() ``` ] .right-plot[  ] --- .left-code[ # Color Brewer <a href="https://cran.r-project.org/web/packages/RColorBrewer/index.html" target="_blank"><button class="button">📦 `RColorBrewer`</button></a> ```r # Display all the palettes library(RColorBrewer) par(mar=c(0,4,0,2)) display.brewer.all() ``` ```r # Notice # - sequential # - qualitative # - diverging ``` ] .right-plot[  ] --- .left-code[ # Pirate palette <a href="https://cran.r-project.org/web/packages/yarrr/vignettes/piratepal.html" target="_blank"><button class="button">📦 `yarrr`</button></a> ```r yarrr::piratepal(palette = "all") ``` ] .right-plot[ 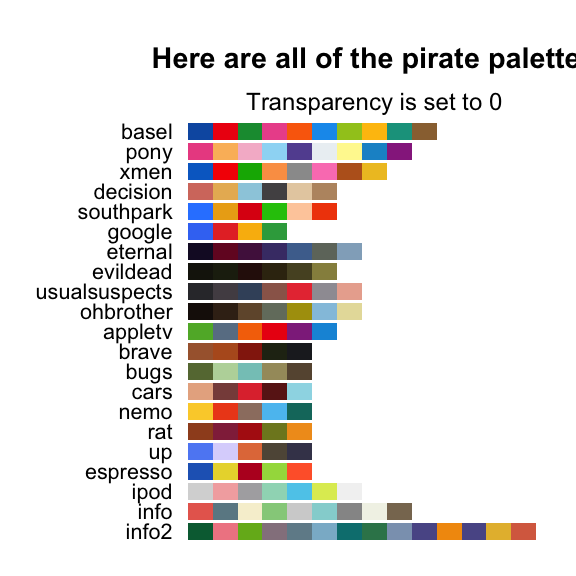 ] --- .left-code[ # Pirate palette <a href="https://cran.r-project.org/web/packages/yarrr/vignettes/piratepal.html" target="_blank"><button class="button">📦 `yarrr`</button></a> ```r yarrr::piratepal( palette = "southpark", trans = .5, plot.result = T) ``` [Pirate pal vignette](https://cran.r-project.org/web/packages/yarrr/vignettes/piratepal.html) ] .right-plot[ 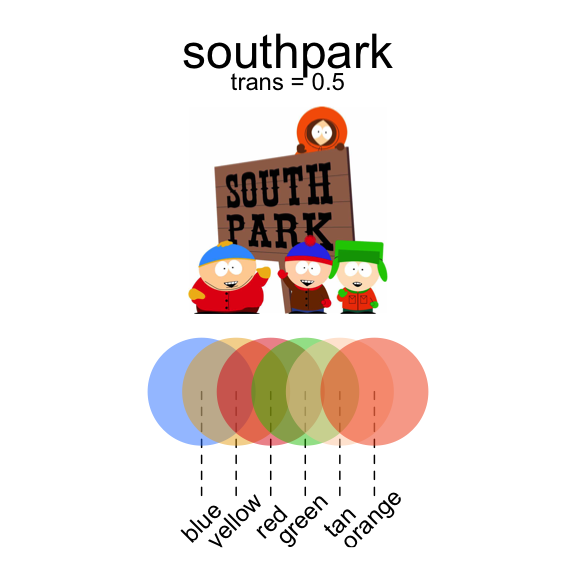 ] --- # ochRe <a href="https://ropensci.org/blog/2017/11/21/ochre/" target="_blank"><button class="button">📦 `ochRe `</button></a> 🎩 Di Cook [@visnut](https://twitter.com/visnut) <img src="images/twinghosts_albertnamatjira.jpg" width="600" style="display: block; margin: auto;" /> --- .left-code[ # ochRe <a href="https://ropensci.org/blog/2017/11/21/ochre/" target="_blank"><button class="button">📦 `ochRe `</button></a> 🎩 Di Cook [@visnut](https://twitter.com/visnut) ```r # devtools::install_github("ropenscilabs/ochRe") library(ochRe) pal_names <- names(ochre_palettes) par(mfrow=c(length(ochre_palettes)/2, 2), lheight = 2, mar=rep(1, 4), adj = 0) for (i in 1:length(ochre_palettes)){ viz_palette(ochre_palettes[[i]], pal_names[i]) } ``` ] .right-plot[ 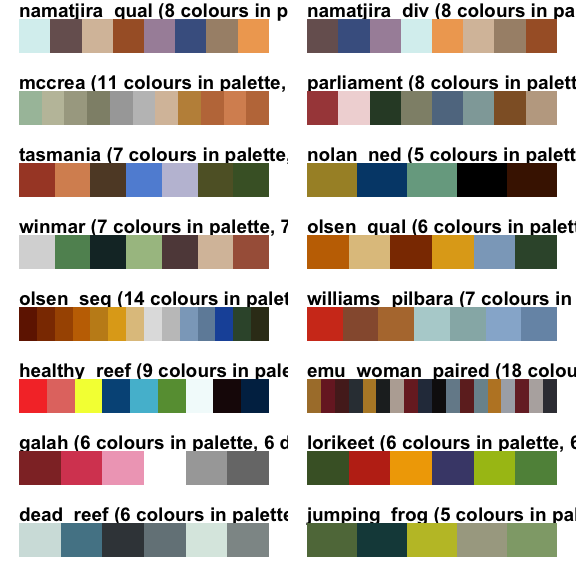 ] --- .left-code[ # Dutchmasters <a href="https://edwinth.github.io/blog/dutch-masters/" target="_blank"><button class="button">📦 `dutchmasters`</button></a> <br> <br> <br> <br> <br> <br> <br> <br> <br> <br> <br> <br> <br> <br> By <a href="https://en.wikipedia.org/wiki/en:Johannes_Vermeer" class="extiw" title="w:en:Johannes Vermeer">Johannes Vermeer</a> - Copied from Mauritshuis website, resampled and uploaded by <a href="//commons.wikimedia.org/wiki/User:Crisco_1492" title="User:Crisco 1492">Crisco 1492</a> (<a href="//commons.wikimedia.org/wiki/User_talk:Crisco_1492" title="User talk:Crisco 1492">talk</a><span style="white-space:nowrap"> ·</span> <a href="//commons.wikimedia.org/wiki/Special:Contributions/Crisco_1492" title="Special:Contributions/Crisco 1492">contribs</a>), <span style="white-space:nowrap">October 2014</span>, Public Domain, <a href="https://commons.wikimedia.org/w/index.php?curid=36351343">Link</a> ] .right-plot[ <img src="images/Meisje_met_de_parel.jpg" width="98%" style="display: block; margin: auto;" /> ] --- .left-code[ # Dutchmasters <a href="https://edwinth.github.io/blog/dutch-masters/" target="_blank"><button class="button">📦 `dutchmasters `</button></a> ```r # devtools::install_github("EdwinTh/dutchmasters") library(dutchmasters) pal_names <- names(dutchmasters) par(mfrow=c(length(dutchmasters)/2, 2), lheight = 2, mar=rep(1, 4), adj = 0) for (i in 1:length(dutchmasters)){ viz_palette(dutchmasters[[i]], pal_names[i]) } ``` ] .right-plot[ 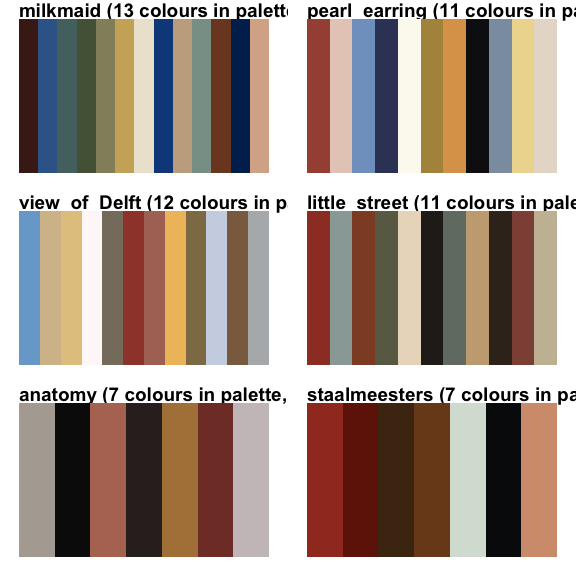 ] --- # Beyonce <a href="https://github.com/dill/beyonce" target="_blank"><button class="button">📦 `beyonce `</button></a> 👑 🐝 ```r #install.packages("devtools") #devtools::install_github("dill/beyonce") #library(tidyverse) library(beyonce) ``` .pull-left[ <img src="images/beyonce.jpg" width="200" style="display: block; margin: auto;" /> ] .pull-right[ <img src="ggplot-colour-palettes_files/figure-html/unnamed-chunk-8-1.png" width="98%" height="350" /> ] --- # Beyonce cont. There are lots of other colour palettes, all adapted from https://beyoncepalettes.tumblr.com/. ```r par(mfrow=c(13,10)) for(i in 1:50) print(beyonce_palette(i)) # just the first 50 ``` <img src="ggplot-colour-palettes_files/figure-html/unnamed-chunk-9-1.png" width="98%" /> --- # Ghibli <a href="https://github.com/ewenme/ghibli" target="_blank"><button class="button">📦 `ghibli `</button></a> 🎩 Jacquie Tran [@jacquietran](https://twitter.com/jacquietran) <img src="images/ghibli.png" width="600" style="display: block; margin: auto;" /> --- .left-code[ # Ghibli <a href="https://github.com/ewenme/ghibli" target="_blank"><button class="button">📦 `ghibli `</button></a> 🎩 Jacquie Tran [@jacquietran](https://twitter.com/jacquietran) ```r library(ghibli) ``` ``` ## Registered S3 method overwritten by 'ghibli': ## method from ## print.palette beyonce ``` ```r # Display palettes with names par(mfrow=c(9,3)) for(i in names(ghibli_palettes)) { print(ghibli_palette(i)) } ``` ] .right-plot[  ] --- .left-code[ # Wes Anderson <a href="https://github.com/karthik/wesanderson" target="_blank"><button class="button">📦 `wesanderson`</button></a> ```r library(wesanderson) ``` ``` ## Registered S3 method overwritten by 'wesanderson': ## method from ## print.palette ghibli ``` ```r # Display palettes with names par(mfrow=c(10,2)) for(i in names(wes_palettes)) { print(wes_palette(i)) } ``` ] .right-plot[  ] --- .left-code[ # Harry Potter <a href="https://github.com/aljrico/harrypotter" target="_blank"><button class="button">📦 `harrypotter`</button></a> 🎩 Anna Fergusson [@annafergusson](https://twitter.com/annafergusson) ```r library(harrypotter) ggplot(data.frame(x = rnorm(1e4), y = rnorm(1e4)), aes(x = x, y = y)) + geom_hex() + coord_fixed() + scale_fill_hp(house = "LunaLovegood") + theme_bw() ``` ] .right-plot[  ] --- # Harry Potter <a href="https://github.com/aljrico/harrypotter" target="_blank"><button class="button">📦 `harrypotter`</button></a> 🎩 Anna Fergusson [@annafergusson](https://twitter.com/annafergusson) <img src="images/luna_lovegood.png" width="600" style="display: block; margin: auto;" /> --- .left-code[ # ggsci <a href="https://cran.r-project.org/web/packages/ggsci/vignettes/ggsci.html" target="_blank"><button class="button">📦 `ggsci`</button></a> A mixture of academic journal palettes and pop culture references. ```r library(ggsci) ggplot(subset(diamonds, carat >= 2.2), aes(x = table, y = price, colour = cut)) + geom_point(alpha = 0.7) + geom_smooth(method = "loess", alpha = 0.05, size = 1, span = 1) + theme_dark() + theme( panel.background = element_rect(fill = "#2D2D2D"), legend.key = element_rect(fill = "#2D2D2D")) + scale_fill_tron() ``` ``` ## `geom_smooth()` using formula 'y ~ x' ``` ] .right-plot[  ] --- class: inverse; middle # What about making your own palette? --- # Setting up your own palette: Pick your colours I love this screenshot from *Into the Spiderverse* and used [this free palette generator](https://www.canva.com/colors/color-palette-generator/) to lazily pull colours from it. <img src="images/intothespiderverse.png" width="600" style="display: block; margin: auto;" /> <img src="images/spiderverse-colours.png" width="500" style="display: block; margin: auto;" /> --- # Setting up your own palette: Load your colours For a more complete discussion see [this great article](https://drsimonj.svbtle.com/creating-corporate-colour-palettes-for-ggplot2) by Dr Simon Jackson [@drsimonj](https://twitter.com/drsimonj). .pull-left[ ```r # Set up the colours you want my_colours <- c( `turquoise` = "#30E6C9", `khaki` = "#D7EA85", `slate` = "#355E78", `old-rose` = "#A83B80", `cadet-blue` = "#77A5BF", `light grey` = "#cccccc", # added extra neutrals `dark grey` = "#8c8c8c") #Function that converts names to hexcodes get_spiderverse_col <- function(...) { cols <- c(...) if (is.null(cols)) return (my_colours) my_colours[cols] } # You could just use this function: ggplot(mtcars, aes(hp, mpg)) + geom_point(color = get_spiderverse_col("old-rose"), size = 4, alpha = .8) + theme_minimal() ``` ] .pull-right[ <img src="ggplot-colour-palettes_files/figure-html/personal-out-1.png" width="98%" /> ] --- # Setting up your own palette: Group colours into palettes ```r spiderverse_palettes <- list( `main` = get_spiderverse_col("turquoise", "khaki", "old-rose"), `blues` = get_spiderverse_col("cadet-blue", "slate"), `full` = get_spiderverse_col("turquoise", "khaki", "slate", "old-rose", "cadet-blue"), `neutral` = get_spiderverse_col("slate", "light grey", "cadet-blue", "dark grey") ) # Helpful function for retrieving the palettes you just names spiderverse_pal <- function(palette = "main", reverse = FALSE, ...) { pal <- spiderverse_palettes[[palette]] if (reverse) pal <- rev(pal) colorRampPalette(pal, ...) } ``` --- # Setting up your own palette: Set up scales for ggplot ```r # Colour scale - good for scatter plots scale_color_spiderverse <- function(palette = "main", discrete = TRUE, reverse = FALSE, ...) { pal <- spiderverse_pal(palette = palette, reverse = reverse) if (discrete) { discrete_scale("colour", paste0("spiderverse_", palette), palette = pal, ...) } else { scale_color_gradientn(colours = pal(256), ...) } } # Fill scale - good for barplots scale_fill_spiderverse <- function(palette = "main", discrete = TRUE, reverse = FALSE, ...) { pal <- spiderverse_pal(palette = palette, reverse = reverse) if (discrete) { discrete_scale("fill", paste0("spiderverse_", palette), palette = pal, ...) } else { scale_fill_gradientn(colours = pal(256), ...) } } ``` --- # How did we do? .pull-left[ ```r ggplot(iris, aes(Sepal.Width, Sepal.Length, color = Species)) + geom_point(size = 4) + scale_color_spiderverse() + theme_minimal() ``` <img src="ggplot-colour-palettes_files/figure-html/unnamed-chunk-14-1.png" width="98%" height="370" /> ] .pull-right[ ```r bey + scale_fill_spiderverse("neutral") + theme_minimal() ``` <img src="ggplot-colour-palettes_files/figure-html/unnamed-chunk-15-1.png" width="98%" height="400" /> ] --- # Accessibility resources - [How to design for colour blindness](https://usabilla.com/blog/how-to-design-for-color-blindness/) with a great link to a [colour blindness simulator](http://www.color-blindness.com/coblis-color-blindness-simulator/) - <a href="https://cran.r-project.org/web/packages/dichromat/dichromat.pdf" target="_blank"><button class="button">📦 `dichromat`</button></a> - Collapse red-green or green-blue distinctions to simulate the effects of different types of color-blindness. --- # Other resources and lists of resources - [Paletti, make your own palettes - from the guy behind the Dutchmasters palette](https://edwinth.github.io/blog/paletti/) - [Good compilation of resources here](https://blog.prototypr.io/another-post-about-colours-for-data-visualisation-part-3-diy-palettes-bfc8c8bad72f) - [Datawrapper blog with resources too](https://blog.datawrapper.de/colorguide/), including Art Palette Experiment by Google, Movies - <a href="http://colorspace.r-forge.r-project.org/articles/hcl_palettes.html" target="_blank"><button class="button">📦 `colorspace`</button></a> - The Colour Space package has lots of great information and palette options. - [Greyscale functionality in ggplot is pretty good](https://ggplot2.tidyverse.org/reference/scale_grey.html) - [Datanovia list of R palettes to know](https://www.datanovia.com/en/blog/top-r-color-palettes-to-know-for-great-data-visualization/) - [This Color Palette Generator by Steven DeGraeve can help make colour palette from an image](https://www.degraeve.com/color-palette/) - Things to think about - which colours do you put next to each other? [Visual blurring is not good](https://datahero.com/blog/2013/08/08/why-color-matters-in-data-visualisation/) --- class: center, middle # Thanks! Slides created via the R package [**xaringan**](https://github.com/yihui/xaringan). The chakra comes from [remark.js](https://remarkjs.com), [**knitr**](http://yihui.name/knitr), and [R Markdown](https://rmarkdown.rstudio.com).